In this guideJump to a section
When one forecast says 100% relative humidity and another says 50%, the first number can sound more humid. Temperature changes the comparison: cold air can be near saturation while containing less water vapor than warmer air with a lower relative-humidity percentage. Dew point helps you compare that outdoor moisture difference.
This is a weather-field comparison, not a room test or health index. For questions about apparent heat, use the heat-index forecast and official safety guidance. For dampness or a reading inside your home, keep using an indoor hygrometer and the separate room humidity guide.
What each field tells you
The National Weather Service explains dew point as the temperature air would need to reach, at constant pressure, to become saturated. Relative humidity is a percentage of saturation at the air’s current temperature. More water vapor is needed to reach saturation at a higher temperature. Cooling air can therefore raise its relative humidity even when no water vapor is added.
| Forecast field | Useful for | Do not infer |
|---|---|---|
| Air temperature | The forecast air temperature for a location and time | How much water vapor is present by itself |
| Relative humidity | How near that air is to saturation at its current temperature | A direct moisture comparison between places or times with different temperatures |
| Dew point | Comparing outdoor moisture content in the same air-level forecast context | Indoor room RH, an exact personal comfort level, or whether precipitation will occur |
The NWS Louisville humidity discussion also explains that relative humidity depends on temperature and that dew point alone is not enough to determine RH; air temperature is also needed. It notes that 100% RH means saturation at that level, not automatically that precipitation will occur.
Two outdoor examples
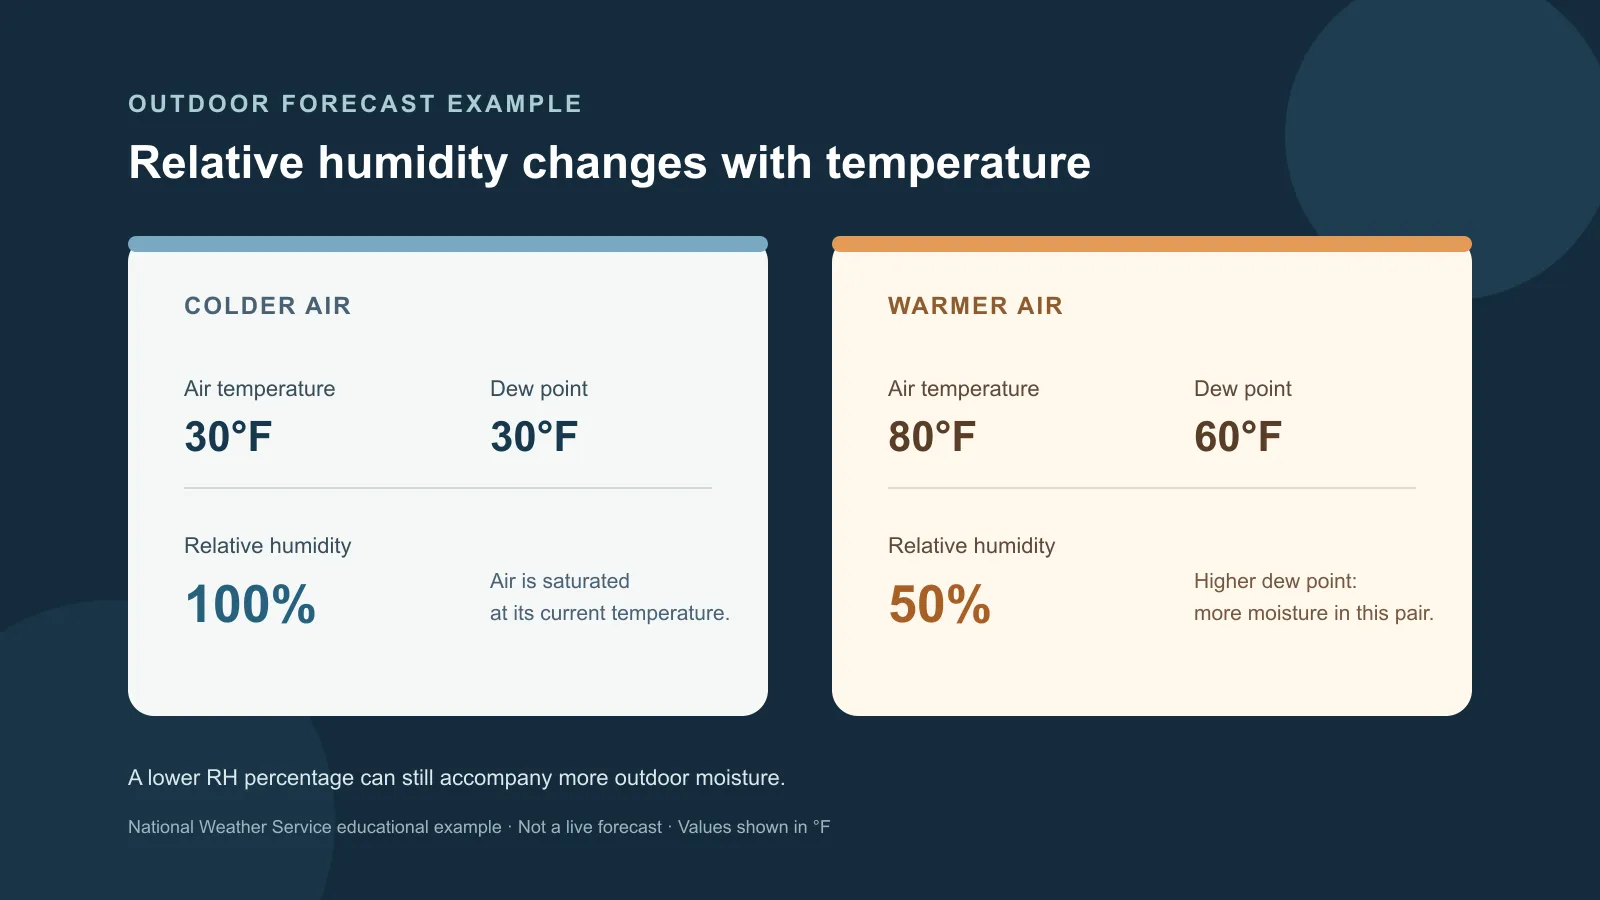
The National Weather Service’s La Crosse page gives these paired examples. They are educational comparisons, not two current conditions or a forecast for your location.
| NWS example field | Cold air | Warm air |
|---|---|---|
| Air temperature | 30°F | 80°F |
| Dew point | 30°F | 60°F |
| Relative humidity | 100% | 50% |
| What it means | Saturated at a lower dew point | Lower RH percentage, higher dew point and more water vapor than the cold example |
The numbers show why RH alone can mislead when you compare different temperatures. They do not tell you what a particular person will feel, whether a building has a moisture problem, or what the temperature or humidity is indoors.
Compare a forecast without mixing readings
If you are comparing weather apps or two days, write the observations side by side. Use the same place and the same valid time; otherwise the values may describe different air masses or forecast periods.
| Record | Forecast A | Forecast B |
|---|---|---|
| Provider and location | ||
| Forecast checked at / valid date and time | ||
| Air temperature and units | ||
| Relative humidity | ||
| Dew point and units | ||
| Question being compared | Same place/time? / different day? | Same place/time? / different day? |
For a room, keep a separate line for room name, indoor temperature, indoor RH, instrument, and time. The EPA moisture guide describes water entering through leaks or indoor activities and condensation forming on cold glass; an outdoor dew-point forecast cannot sort those indoor causes. If you see persistent wetness, follow the window observation and handoff steps in condensation on windows.