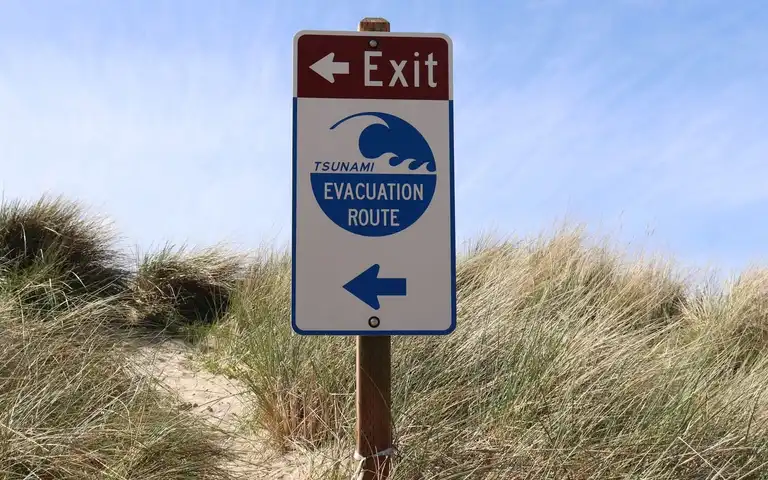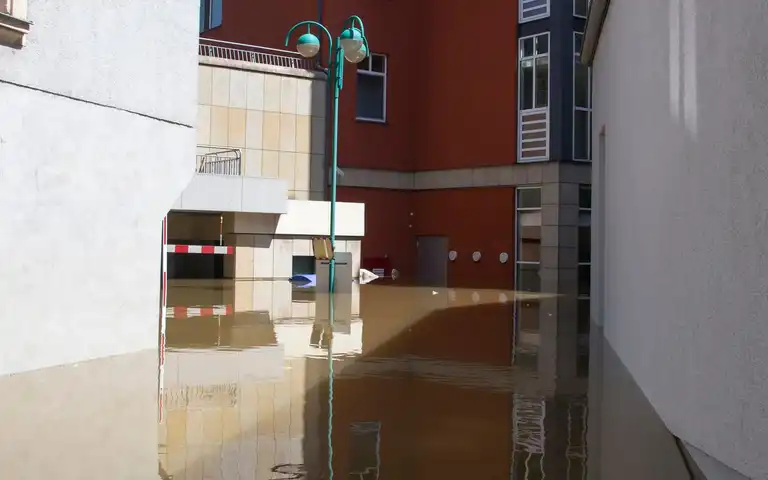
A state-level disaster ranking cannot tell you whether one home, workplace, or route faces a particular hazard. Start with the actual address or county, choose a source built for the hazard, and record its map scale and date. Use current local alerts and emergency-management directions for decisions during an event. The flood evacuation plan explains what to do with flood warnings and route decisions; this page is the lookup step across hazards.
Look up the place, then choose the hazard
Record the home and other places that matter—work, school, care locations, and a likely destination—without posting private addresses in a public group. Then use a source appropriate to the question:
| Question | Start with | What it can support | What it cannot establish | Who Should Skip It / Operating Limit |
|---|---|---|---|---|
| How do national models compare community hazard measures? | FEMA’s Hazard Explorer, including the National Risk Index | A broad community-level planning comparison across hazards | A building inspection, parcel determination, live warning, or decision to evacuate | Skip if seeking parcel-level engineering data or live emergency orders; fails at building scale. |
| Is an address shown on a mapped flood-hazard product? | FEMA’s Flood Map Service Center | Find official flood-hazard products for the location | That a place outside a mapped area cannot flood, or that roads are passable now | Skip for live flash flood forecasts or unmapped overland sheet flow analysis. |
| What earthquake shaking hazard is estimated for the area? | USGS earthquake information by state and its hazard maps | Estimated shaking hazard across regions and state resources | The nearest fault alone does not determine risk; maps do not evaluate a building | Skip for site-specific soil liquefaction or structural seismic retrofit engineering design. |
| Is a weather warning active now? | The National Weather Service hazards map and local emergency management | Current NWS warning information and the full linked alert | Long-term risk, every local hazard, road closure status, or local evacuation order | Skip for historical return-period return intervals or property flood risk mapping. |
FEMA’s National Risk Index is a community-level dataset, while USGS describes earthquake maps as estimates of shaking likelihood. These can help you decide what local questions to ask, but they do not describe one property’s construction, drainage, elevation, maintenance, or immediate surroundings. A county or state comparison can also hide important differences between neighborhoods and individual hazards.
Worked Sizing / Physics Calculation for Hazard Scale
To quantify hazard exposure, emergency planners compute probabilistic return intervals and spatial overlay bounds:
- Annual Exceedance Probability (AEP): P = 1 - (1 - 1/T)^n, where T is the return period (e.g., 100 years) and n is the structure exposure duration in years (e.g., 30 years for a mortgage window).
- Calculated 30-Year Flood Risk Probability: For a 100-year floodplain (T = 100), P = 1 - (0.99)^(30) ≈ 26% cumulative probability of experiencing at least one base flood event during the timeframe.
- Peak Discharge Scaling: Q = C × i × A, where C is runoff coefficient (0.65 for saturated urban soil), i is rainfall intensity (2.5 inches/hour), and A is drainage basin area (45 acres), yielding Q = 73.125 cubic feet per second (cfs) runoff requiring proper culvert capacity.
Keep planning maps separate from active instructions
A hazard map is for planning. A warning, evacuation order, road closure, or shelter opening is time-sensitive. When an event is underway, check the issuing local authority and the full message, including its time, area, action, and route. The NWS hazards map says that only the most significant threat for a forecast zone is shown at once; open the zone forecast for the full list. A map that has not updated, an old screenshot, or a familiar route is not proof that a road is open.
If the official map or source is unavailable, save the agency name and contact path, then ask local emergency management which current map, alert system, and route instructions apply to the address. Do not replace a missing map with a state ranking or an unverified social post.
Local hazard lookup record
| Record | Note |
|---|---|
| Place or area checked (keep private) | |
| Hazard and question | |
| Official source and map or product name | |
| Geography shown (state, county, tract, parcel, forecast zone) | |
| Publication or update date | |
| What the source supports | |
| Limitation or unresolved question | |
| Local emergency-management contact | |
| Current alert or closure source to check during an event |
Repeat the lookup when moving, changing a regular destination, or when the responsible agency updates its maps. For what to do after the alert arrives, use the relevant hazard guide and follow the current local instructions.
Troubleshooting Local Hazard Discrepancies and Map Limitations
When reconciling conflicting hazard maps across federal, state, and county platforms, discrepancies frequently arise due to differing interpolation models, LiDAR elevation dataset vintage, and grid resolution scales. For instance, FEMA flood insurance rate maps (FIRMs) rely on hydraulic modeling that may lag behind rapid urban impervious surface expansion by 5 to 10 years. To maintain operational readiness, households must never rely on a single static PDF map. Always cross-reference the digital web portal metadata for the exact coordinate release date, contour interval, and vertical datum (such as NAVD 88). If municipal emergency management reports a localized flash flood hazard that exceeds regional modeled boundaries, defer unconditionally to local ground observations and official evacuation orders. Maintain offline printed snapshots of critical parcel evacuation routes in a waterproof container, ensuring accessibility during wide-area telecommunication disruptions. Additional considerations include checking local municipal storm sewer capacity thresholds, verifying regional watershed association bulletins, establishing mutual-aid verification protocols with building superintendents, coordinating emergency radio channel presets for VHF/UHF amateur bands or NOAA weather radio specific event messaging (SAME), auditing historical high-water mark monuments with county surveyors, reviewing seasonal groundwater table fluctuations during extended drought or torrential saturation cycles, confirming secondary egress route clearance under heavy fallen timber or debris blockage scenarios, ensuring that all digital bookmarks are exported to physical card stock for family members without smartphone access, coordinating annual tabletop walkthroughs with neighbors residing in the same flood or wildfire risk basin, verifying backup power availability for local repeater stations supporting neighborhood walkie-talkie networks, and establishing clear thresholds for voluntary relocation hours before mandatory curfews are enforced by local public safety officers.