In this guide Jump to a section
Sizing a portable generator or home battery backup by reading the manufacturer stickers on your appliances leads to expensive errors. Nameplate ratings show worst-case electrical draws under maximum laboratory strain. A modern inverter refrigerator with a 750W nameplate rating might run at 110W during typical cooling cycles, but its compressor and defrost heater can pulse to 650W, and its startup inductive surge can briefly spike to 1,400W.
If you calculate your backup needs strictly from stickers, you will overbuild a generator system by thousands of dollars or under-size a portable battery bank that shuts down from inverter overload the first time a sump pump kicks on.
Deploying energy monitoring before bad weather hits gives you empirical data. By combining whole-home electrical panel monitors with branch-circuit current transformers (CT clamps) and plug-in smart meters, you can record exact continuous wattages, duty cycles, and phantom baseline loads.
Worked Engineering Calculation: Sizing Battery Backup via Real Telemetry vs Nameplate Stickers
To understand the financial and technical difference that power logging makes, consider a standard four-person household preparing for a 48-hour winter blackout. The family wants to sustain five critical circuits:
- Kitchen refrigerator/freezer
- Basement 1/2 HP sump pump
- Natural gas forced-air furnace (blower fan and electronic controls)
- Home network stack (fiber ONT, router, PoE switch with 4 security cameras)
- Living room lighting and device charging bank
The Theoretical Nameplate Calculation
Reading the maximum UL tags on each unit yields the following assumptions:
- Refrigerator: 750 W × 24 hr = 18,000 Wh/day
- Sump pump: 1,050 W × 4 hr runtime = 4,200 Wh/day
- Gas furnace: 800 W × 12 hr runtime = 9,600 Wh/day
- Home networking: 120 W × 24 hr = 2,880 Wh/day
- LED lighting and phones: 150 W × 8 hr = 1,200 Wh/day
- Total estimated 24-hour consumption: 35,880 Wh (35.88 kWh/day)
Under this sticker-based calculation, a homeowner would conclude that powering these basic appliances requires an industrial 36 kWh stationary battery system costing upwards of 22,000. dollars
The Real CT Clamp Telemetry Calculation
After installing a whole-home panel monitor and smart plugs logging second-by-second data over 14 winter days, the empirical metrics look drastically different:
| Load Item | Continuous Running Draw | Measured Duty Cycle | Average Hourly Consumption | Daily Energy (Wh) | Peak Inductive Inrush Spike |
|---|---|---|---|---|---|
| Inverter Refrigerator | 115 W | 38% (9.12 hr/day) | 43.7 Wh/hr | 1,049 Wh | 1,280 W (0.2 sec) |
| Sump Pump (1/2 HP) | 880 W | 4% (0.96 hr/day) | 35.2 Wh/hr | 845 Wh | 2,450 W (0.4 sec) |
| Gas Furnace Blower | 420 W | 30% (7.2 hr/day) | 126.0 Wh/hr | 3,024 Wh | 1,150 W (0.3 sec) |
| Network & PoE Cameras | 48 W | 100% (24 hr/day) | 48.0 Wh/hr | 1,152 Wh | 52 W (negligible) |
| LED Lamps & Phone Docks | 42 W | 25% (6 hr/day) | 10.5 Wh/hr | 252 Wh | 45 W (negligible) |
| Monitored Real Total | 1,505 W (Max Coincident) | Variable | 263.4 Wh/hr | 6,322 Wh/day | 3,950 W (Max Worst Spike) |
Battery Sizing Deduction
The actual energy required to run this critical household stack for 24 hours is 6.32 kWh, not 35.88 kWh.
To run these appliances for 48 hours without grid power:
- Required usable capacity = 6,322 Wh × 2 days = 12,644 Wh (12.64 kWh).
- Factoring in an 85% round-trip inverter and temperature efficiency derating: 12,644 ÷ 0.85 = 14,875 Wh (14.88 kWh nominal LiFePO4 storage).
- Inverter surge requirement: The inverter must handle the coincident startup spike if the sump pump (2,450W surge) starts while the refrigerator compressor (1,280W surge) and furnace blower (1,150W surge) are already running. A continuous 3,500W / surge 6,000W pure sine wave inverter comfortably manages this threshold.
Instead of an unaffordable 22,000-dollar investment, empirical monitoring allows the homeowner to assemble a 15 kWh modular LiFePO4 battery setup or select an appropriately sized 5,000W inverter generator running in eco-throttle mode, consuming a third of the fuel.
Panel-Level CT Monitoring vs Plug-In Energy Monitors
Both metering methods offer distinct strengths. Neither replaces the other when planning for extended grid disruptions.
Whole-Home Panel Monitors (CT Clamps)
Panel-level monitors use split-core Current Transformers clipped around insulated feeder cables inside your service entrance or subpanel. A sensor reads the magnetic field produced by alternating current passing through the conductor and reports amperage, line voltage, active power (watts), and power factor.
Primary Advantages:
- Captures 240V Major Loads: Accurately tracks heavy appliances that cannot plug into a standard 120V receptacle, including well pumps, central heat pumps, electric water heaters, and electric ranges.
- Whole-House Overview: Shows total household power demand at the 200A service mains, capturing the combined load profile across all lighting and hardwired circuits.
- Phantom Load Discovery: By reviewing nighttime telemetry when the household is asleep, you can identify hidden continuous draws (audio receivers in standby, cable boxes, hot water recirculating loops) that silently drain 200W to 400W.
Key Limitations:
- Panel Access Required: Requires removing the panel dead-front cover. Installation must comply with NFPA 70 Article 750 and often requires a licensed electrician.
- Renter Incompatibility: Renters in multi-family buildings rarely have permission to access or modify panel wiring.
- Branch Circuit Limitations: Standard budget systems track 8 to 16 individual circuits. Large homes with 40 or more breakers require multiple expansion units.
Plug-In Smart Plugs with Power Monitoring
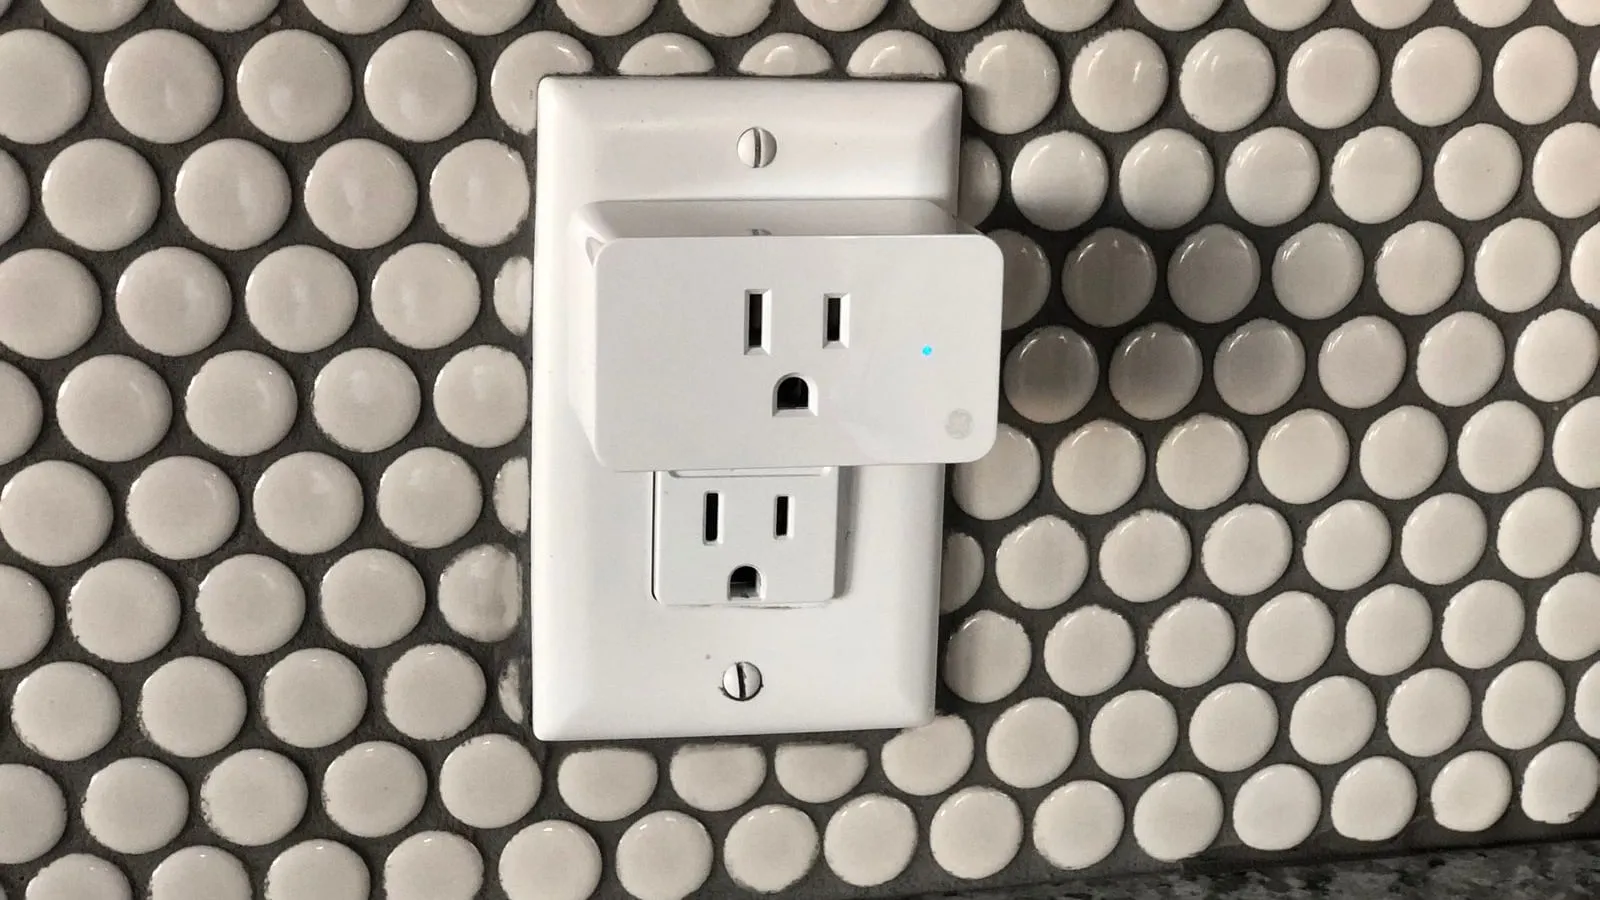
Plug-in adapters sit between the wall receptacle and the appliance cord. Internal metering chipsets (such as the BL0937 or HLW8032) measure current and voltage directly.
Primary Advantages:
- Zero Electrical Modifications: 100% renter-friendly. Simply plug the module into any standard 120V NEMA 5-15 wall socket.
- Granular Appliance Profiling: Isolates individual devices on shared circuits. A panel CT on a 20A kitchen circuit reads everything on that branch combined; a smart plug isolates whether the power draw came from the refrigerator, the microwave, or the under-cabinet lighting.
- Automated Outage Load Shedding: Modern smart plugs can be configured to automatically cut power to non-critical appliances when a blackout is detected, conserving precious battery backup.
Key Limitations:
- 120V Receptacles Only: Cannot monitor hardwired 240V equipment or directly hardwired furnace blowers without specialized inline relays.
- Continuous Load Limits: While rated for 15A (1,800W) peak, the National Electrical Code specifies that continuous resistive loads (running 3 hours or more) must not exceed 80% of rating (12A or 1,440W). Running a space heater at 1,500W through a cheap smart plug can melt the casing.
| Feature / Metric | Whole-Home Panel CT Monitor | 15A/16A Monitoring Smart Plug | Portable Kill A Watt Meter |
|---|---|---|---|
| Typical Cost | 150 to 350 dollars | 12 to 25 dollars per plug | 25 to 35 dollars |
| Voltage Compatibility | 120V and 240V Split-Phase | 120V Single-Phase only | 120V Single-Phase only |
| Installation Complexity | Electrical panel wiring (High) | Plug-and-play (Zero) | Plug-and-play (Zero) |
| Rental Suitability | Poor (Requires landlord approval) | Excellent (Fully portable) | Excellent (Fully portable) |
| Continuous Logging | Automated second-by-second | Automated minute-by-minute | Manual display reading |
| Local Offline Operation | Model-dependent (Shelly/IoTaWatt yes; Sense/Emporia cloud) | Protocol-dependent (Zigbee/Matter/Tasmota yes; Tuya cloud) | 100% offline (On-device LCD screen) |
| Surge / Inrush Capture | Yes (High-frequency sampling) | Limited (May miss millisecond peaks) | No (Displays slow RMS average) |
The Offline Telemetry Trap: Local-First vs Cloud-Dependent Monitors
During a major natural disaster or grid failure, terrestrial internet infrastructure routinely drops within hours as telecom backup batteries exhaust. If your energy monitoring system relies on cloud servers to process telemetry, your smart dashboard goes completely blank precisely when you need to manage your emergency power.
Cloud-Dependent Architectures (The Vulnerability)
Mainstream consumer energy monitors transmit raw sensor packets to AWS or proprietary manufacturer clouds via Wi-Fi. The mobile app queries the cloud server rather than your local network. When the broadband fiber or cable line goes dead:
- Real-time power dials freeze.
- Historical data cannot be accessed.
- Smart plugs cannot receive automated shutoff commands from your phone.
- You are left flying blind, unaware of how many watts your backup battery is outputting.
Local-First Architectures (The Resilient Standard)
Resilient outage planning demands local-first telemetry that broadcasts over your home local area network (LAN) without requiring an active WAN internet connection:
- Local CT Monitors: Devices like the Shelly Pro 3EM, IoTaWatt, or Emporia Vue flashed with open-source ESPHome firmware communicate directly with a local Home Assistant server or display local web pages over private Wi-Fi.
- Local Protocol Smart Plugs: Smart plugs using Zigbee 3.0, Z-Wave Plus, or Thread/Matter report power metrics directly to a local home hub. They execute automated load-shedding routines even if the outside world is disconnected.
- Hardware Fallback: Always maintain at least one manual plug-in meter with an integrated LCD screen (such as a classic P3 Kill A Watt). If your Wi-Fi router loses power, a hardware meter provides instant diagnostic metrics at the wall socket.
Critical-Load Energy Audit Checklist
Follow this systematic step-by-step process across a 14-day logging window before purchasing backup power equipment.
- Step 1: Map your target survival appliances
- List every device required for food preservation, medical support, structural safety (sump pumps), winter heat, and communication.
- Step 2: Inspect manufacturer physical nameplates
- Note the Voltage (V), Amperage (A), and Frequency (Hz) on each appliance sticker.
- Multiply Volts × Amps to establish the absolute mathematical ceiling (Volt-Amperes).
- Step 3: Measure baseline continuous running watts
- Connect each 120V appliance to a monitoring smart plug or inline meter for at least 48 continuous hours.
- Record the actual running wattage while the appliance compressor or motor is actively cycling.
- Step 4: Calculate empirical duty cycles
- Divide the total kilowatt-hours consumed in 24 hours by the running wattage to find the operating fraction.
- A refrigerator pulling 120W that consumes 1.2 kWh per day runs for 10 hours total (a 41.7% duty cycle).
- Step 5: Measure or calculate inductive motor startup surge
- Inductive loads (compressors, sump pumps, well pumps) draw 3× to 6× their continuous running wattage for 100 to 500 milliseconds during rotor acceleration.
- Check the compressor tag for LRA (Locked Rotor Amps). Calculate Surge Watts as LRA × 120V (or 240V).
- Step 6: Audit baseline phantom loads
- Measure standby power on electronics, microwave clocks, chargers, and entertainment consoles.
- Disconnect or switch off non-essential phantom draws to recover 150W to 300W of continuous inverter capacity.
- Step 7: Size the emergency power source
- Add the continuous running watts of all simultaneously operating appliances to determine required continuous inverter capacity.
- Add the single largest motor surge spike to the total continuous load to determine required peak surge capacity.
- Multiply average hourly consumption by desired autonomy hours (e.g., 48 hours) to determine battery watt-hour storage.
Frequently Asked Questions
Can I monitor a 240V well pump or water heater with smart plugs?
No. Standard consumer smart plugs are designed exclusively for 120V NEMA 5-15 or 5-20 receptacles with a 15A or 20A limit. Monitoring 240V split-phase appliances requires either a whole-home panel monitor equipped with CT clamps placed over both hot conductors (L1 and L2) or an industrial 240V heavy-duty inline smart switch (such as an Aeotec Heavy Duty Smart Switch).
Why does my smart plug show a higher wattage than the manufacturer manual states?
Manufacturer manuals typically state average laboratory power consumption under mild ambient conditions. An older refrigerator working in a warm kitchen or experiencing heavy frost buildup on cooling coils draws significantly more power to maintain target temperatures. In addition, when the defrost heating element cycles on (often 400W to 600W for 20 minutes once or twice daily), power draw increases substantially above standard compressor cooling.
How do phantom loads impact generator and battery runtimes during a blackout?
Phantom loads—energy consumed by electronics while turned off or in standby mode—average between 100W and 300W in typical homes. On utility power, an extra 150W costs roughly 15 to 20 dollars per month. On an emergency battery backup, however, an unchecked 150W phantom draw consumes 3.6 kWh over 24 hours. That parasitic loss can drain more than half the usable capacity of a standard 5 kWh home battery system without running a single critical appliance.
Is it safe to leave a refrigerator plugged into a smart plug permanently?
Only if the smart plug carries genuine safety certifications (UL 916, ETL, or CSA) and is rated for a 15A continuous resistive load. Avoid cheap uncertified smart plugs purchased from unverified marketplace sellers. Ensure the smart plug has a configurable “Power-On State” setting configured to “Always ON” or “Last State.” This ensures that if the house experiences a temporary brownout, the plug automatically restores power to your refrigerator when utility or generator power returns without waiting for an app command.